Bubble slide
The Bubble slide type lets you create a bubble chart in your presentation by selecting board groups, an x-axis column, a y-axis column, and an optional size column. This slide type is perfect for visualizing relationships between three variables, where the size of each bubble represents an additional dimension of data.
Key Features
-
X-Axis, Y-Axis, and Size Configuration:
- X-Axis: Select a column to represent the horizontal axis.
- Y-Axis: Choose a column for the vertical axis.
- Size: Specify a column to control the size of the bubbles.
-
Calculation Options: Determine how to calculate the y-axis values: Sum (default), Average, Median, Min or Max
-
Display Settings:
- Show Empty Values: Choose whether to include empty x-axis values. This feature is disabled by default.
- Show Default/Unassigned Values: Decide whether to include default or unassigned x-axis value. This feature is disabled by default.
For details on supported columns for bubble slides, refer to the Board Column Support section.
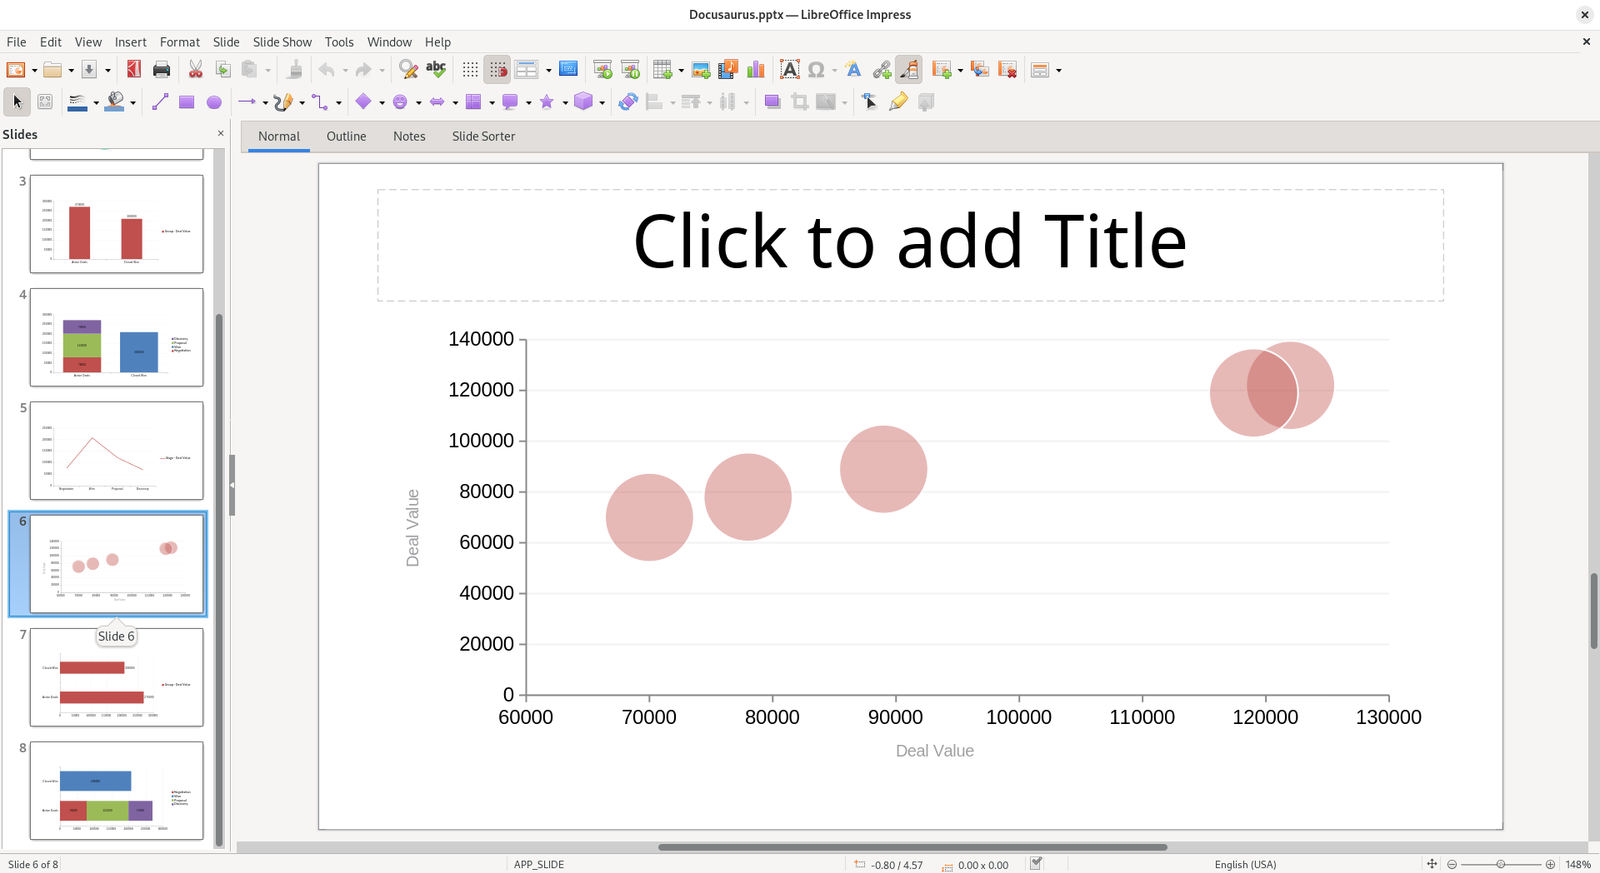
Example
Here’s how a bubble slide will appear in your presentations: